What Taupō District’s Rate System Is Really Costing Our Smaller Towns.
By Epitomeofcoolness
Would you pay $3,200 a year in rates if your home was only worth $465,000?
What if your neighbour with a $2.3 million home only paid $6,000 for the same water, the same bins, and the same pipes?
I didn’t start this to stir the pot. I just wanted to understand how our rates are calculated, and whether they’re fair for everyone across the district. So I started comparing, street by street, property by property.
Fifty properties later, across Mangakino, Turangi, Motuoapa, Taupō, Kinloch, Omori, and beyond; the pattern was clear:
The smaller your town and the lower your property value, the heavier your rates hit; not in dollars, but in weight.

A Kinloch property paying less than 0.32% of its value — with the same water and sewerage charges.

A Mangakino property paying over 0.70% of its value in rates.
THE MATH: WHAT EVERYONE PAYS
These flat service charges are applied nearly identically to most ratepayers:
| Charge | Amount |
| Water Supply | $833.81 |
| Sewerage Disposal | $1,118.83 |
| Refuse Collection | $154.18 |
| Uniform Annual General Charge (UAGC) | $250.00 |
That’s $2,356.82 in fixed costs, before the general rate (based on your property value) is even added.
Now here’s the issue:
Whether you live in a $2.3 million lifestyle property in Acacia Bay, or a $465,000 house in Mangakino, you’re paying those same charges.
SIDE-BY-SIDE COMPARISONS
Here’s how that plays out:
| Town | Capital Value | Total Rates | % of CV Paid |
| Tokaanu | $395,000 | $3,127.35 | 0.79% |
| Mangakino | $465,000 | $3,263.90 | 0.70% |
| Turangi | $915,000 | $4,141.71 | 0.45% |
| Ngā Roto (Taupō) | $1,890,000 | $6,043.64 | 0.32% |
| Kinloch | $1,830,000 | $5,926.60 | 0.32% |
| Acacia Bay | $3,180,000 | $6,607.41 | 0.21% |
So even though homes in Mangakino or Tokaanu are worth a fraction of those in Taupō or Kinloch, they’re still paying nearly the same in dollar terms and far more proportionally.
SPECIAL CASES: MULTIPLE CHARGES, MISSING CONSISTENCY
One property in Motuoapa, on shared land with two homes and two toilets, was charged two sewerage disposal fees and two UAGCs. It’s also located directly beside public toilets a council asset that doesn’t pay rates itself but draws on the same infrastructure.
Meanwhile, another property just down the road, also on a shared title, didn’t appear to be charged for two connections at all.
So what’s the rule here?
And is it being applied evenly?
These inconsistencies matter; not just to the households paying extra, but to anyone trying to trust the system.

Motuoapa property with two toilets and an extra dwelling, beside a public toilet block.
WHO’S ACTUALLY PAYING?
The general rate (calculated as 0.0019507 × Capital Value) seems to work fairly on the surface. Higher-value homes pay more as they should.
But when you layer in flat service fees, you start to see a shift:
They don’t scale.
They don’t consider income or town size.
And they place more pressure on low-value towns with fewer resources
Put simply : the smaller your town, the heavier your rates feel; not because you’re paying more, but because you’re getting less for what you pay, and paying more of your home’s value just to keep up.

Taupō District Council anticipates sharp rate increases well above their own financial benchmark for the next three years, before tapering off.
(Source: Taupō District Council Long-Term Plan 2024–2034, p. 10)
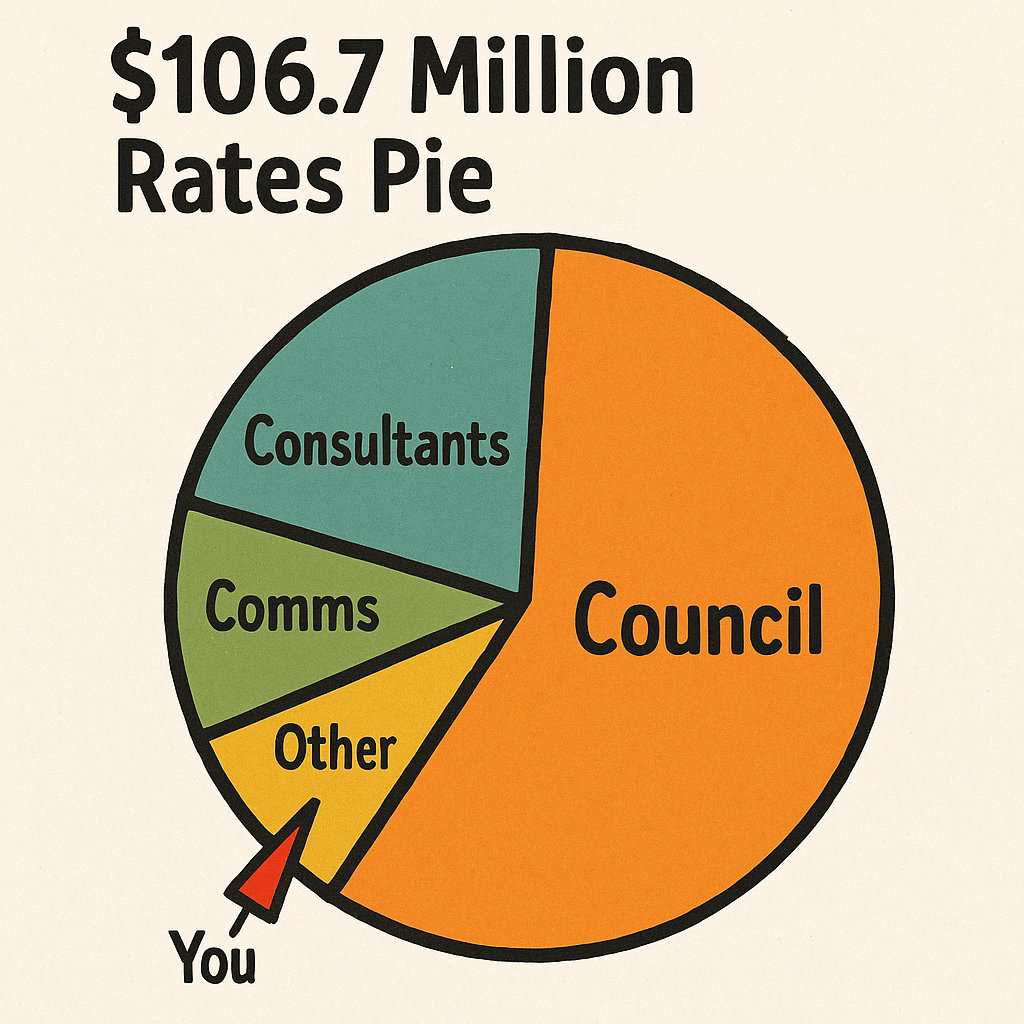
Council expects to collect over $106.7 million in rates this year. That’s a big pie. Where’s your slice?
WHO’S CARRYING WHO?
I’m not asking for outrage… just honesty.
Because when a Mangakino household pays over 0.70% of their property value in rates, and a Kinloch home pays less than 0.30%, that’s not just maths. That’s an imbalance.
The general rate scales with value; fair enough. But the fixed charges don’t. They hit everyone the same in dollars, but not the same in impact.
So here’s the question I’ll leave with you:
If we all use the same pipes, Why are some of us paying so much more just to keep them running?
Note: No house numbers or identifying personal data has been included.
Towns and general figures only.
SOURCES & REFERENCES:
Taupō District Council Rating Information Database (2024/25)
https://www.taupodc.govt.nz/rates/search
Used to gather rating examples across 50+ properties from Taupō, Tūrangi, Mangakino, Motuoapa, Kinloch, Omori, Kuratau, Acacia Bay, and Botanical Heights.
Taupō District Council Draft Long-Term Plan 2024–2034 (PDF)
https://www.taupodc.govt.nz/repository/libraries/id:25026fn3317q9slqygym/hierarchy/Council/Plans%20and%20strategies/LTP/Taupo%20District%20Council%20Long-term%20Plan%202024-34.pdf
Key source for:
General Rates: $65.3M in 2024/25, rising to $98.2M by 2034
Targeted Rates: $41.3M in 2024/25, rising to $76.8M by 2034
Total rates to be collected in 2024/25: $106.7MTaupo District Council …
Average rates per property: $4,391 (excl. GST)Taupo District Council …
Number of rating units in 2024/25: 24,297Taupo District Council …
Fixed Charges Breakdown (UAGC + Targeted Rates)
Uniform Annual General Charge (UAGC) and Targeted Rates (including Wastewater, Water Supply, Stormwater, Refuse Collection) are flat charges applied across the district, regardless of land value.
Total water-related charges in 2024/25: $18M (excluding water by meter)Taupo District Council …
Wastewater Targeted Rates: $21.1M in 2024/25Taupo District Council …
Funding Impact Statement – Community Facilities and Infrastructure
Community facilities funded primarily through general rates, not targeted rates, e.g. parks, libraries, etc.Taupo District Council …
Growth & Property Numbers
Annual growth in rating units projected at ~200–300 per year
Average increase in property rates for 2024/25: $516 + GST


Leave a Reply